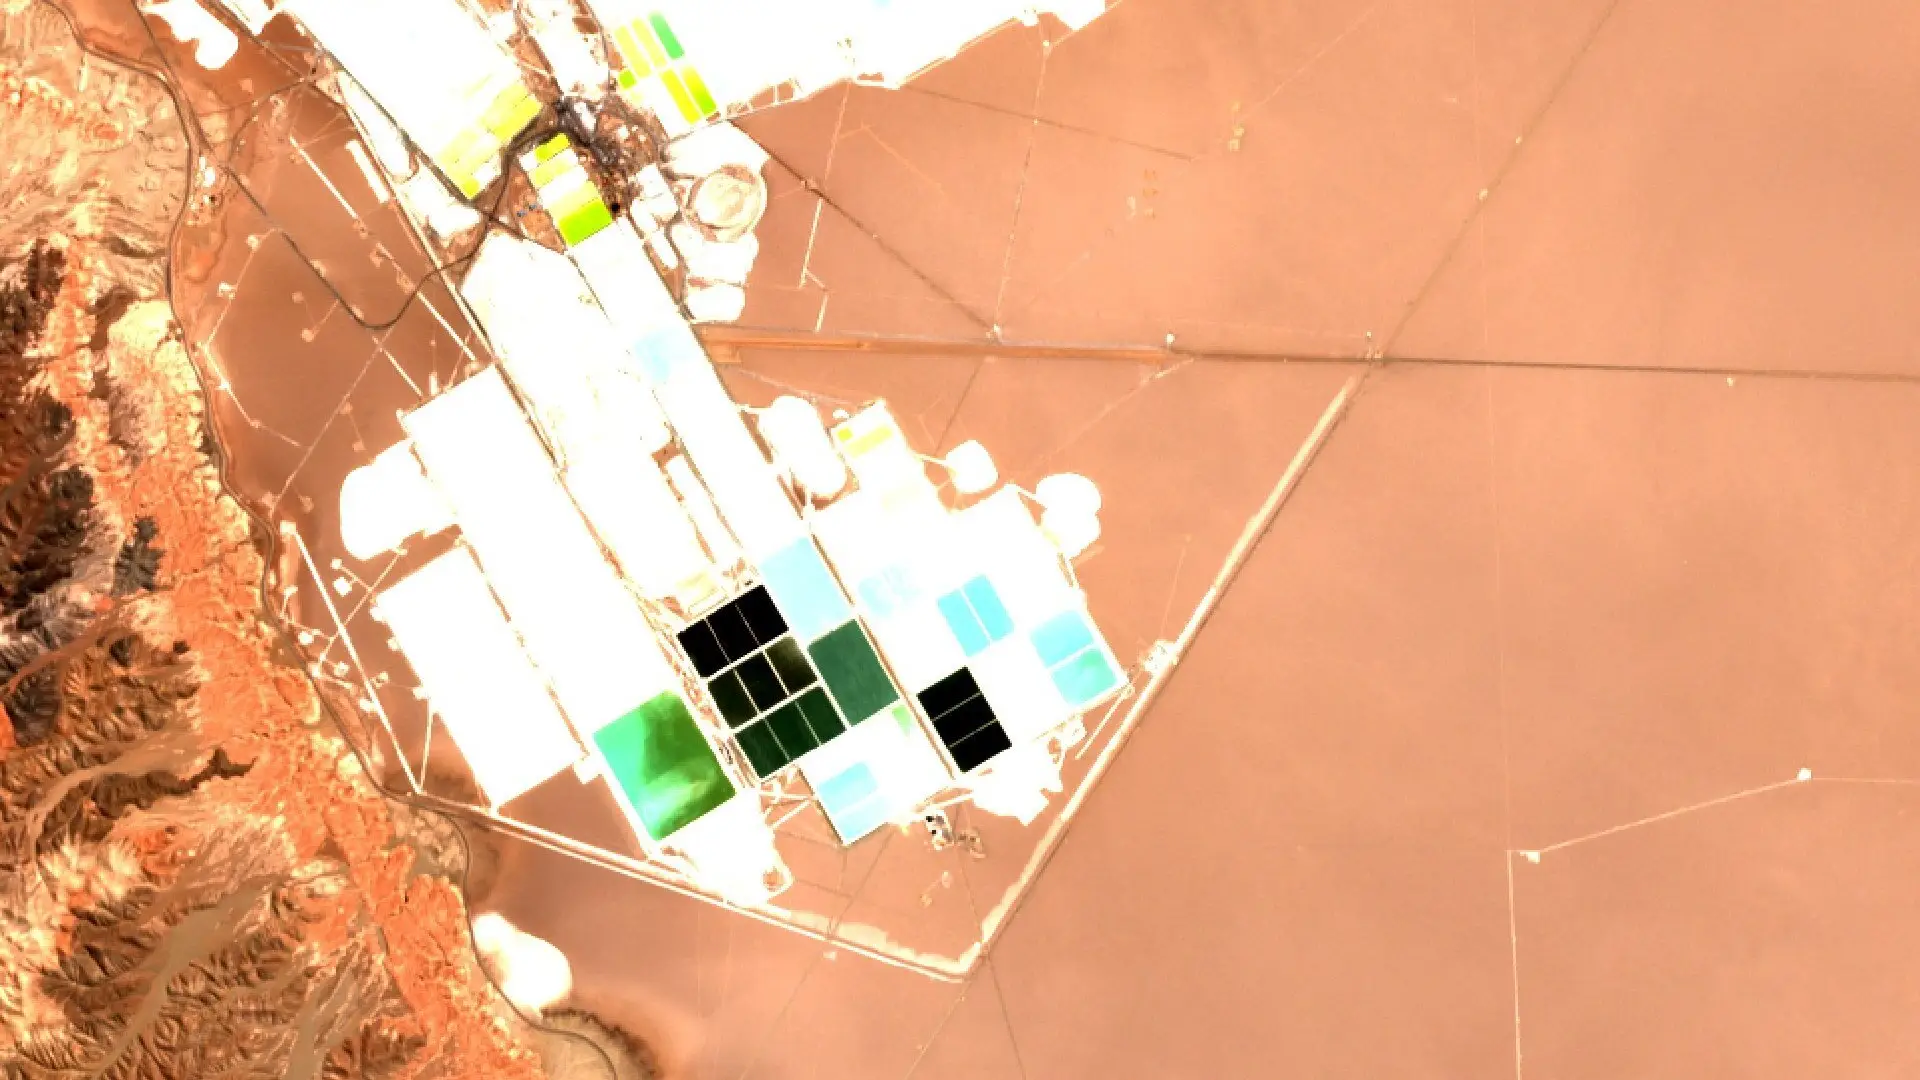
Most mines and brine fields are remote, large and slow to report. Satellite imagery gives commodity traders, analysts, lenders and insurers of mining assets a view of the same sites that does not depend on a company statement or a site visit. The picture above shows part of the Salar de Atacama in Chile, where lithium and potash are concentrated in evaporation ponds [1][2].
Lithium brine ponds
Brine is pumped into a series of ponds and left to evaporate, and the concentration of the brine rises from one pond to the next [2]. Open Sentinel-2 imagery, free under the Copernicus programme [3], is enough to see which ponds are in use, where new ponds have been built and how the footprint of an operation changes from season to season [4]. Sharper commercial imagery shows pond edges, pumps and roads in more detail.
Open-pit gold
At the Super Pit in Kalgoorlie, Western Australia [5], repeat imagery can show the pit widening and deepening, waste dumps growing and tailings dams filling [6]. A lender can compare these changes with the development plan. An insurer can check that the site looks as the schedule says it should after a flood, a fire or a dam concern.
Iron ore stockpiles
In the Pilbara [7], iron ore sits in stockpiles at mines and at port. Stereo imagery, which captures a site from two angles, makes it possible to estimate the height of a pile and from that its volume [8]. Tracking those piles over weeks gives an independent signal on whether production is being drawn down or building up, and a trader can set it against reported output.
Choosing the imagery
Open data suits regular, wide-area checks. Very-high-resolution imagery at 30 cm suits close inspection of a single pit, pond or pile. Data Sphere brings several suppliers together, including Orbview, Vantor and Esper, alongside free Sentinel data, so one search covers both kinds.
The imagery for this work can be searched across suppliers on Data Sphere. To see it for a site you follow, write to info@astrodynamic.space.
References
- European Space Agency. PAZ reveals how lithium extraction causes sinking land. ESA Earth Online, 2026. https://earth.esa.int/eogateway/success-story/paz-reveals-how-lithium-extraction-causes-sinking-land
- Torres, D., Pérez, K., Galleguillos Madrid, F., Leiva, W. and others. Salar de Atacama Lithium and Potassium Productive Process. Metals, 14(10), 1095, 2024. https://doi.org/10.3390/met14101095
- European Space Agency. Free access to Copernicus Sentinel satellite data. ESA, 2013. https://www.esa.int/Applications/Observing_the_Earth/Copernicus/Free_access_to_Copernicus_Sentinel_satellite_data
- Copernicus Programme. Diverse landscape of the Atacama desert captured by Sentinel-2. European Union, 2016. https://www.copernicus.eu/en/diverse-landscape-atacama-desert-captured-sentinel-2
- Northern Star Resources. KCGM Operations. Northern Star Resources Ltd (operator’s own page). https://www.nsrltd.com/our-assets/kcgm-operations/
- Li, Z., Zhao, Y., Ren, H., He, T. and Sun, Y. A Novel Approach to Automatically Identify Open-Pit Coal Mining Dynamics Based on Temporal Satellite Images. Remote Sensing, 17(6), 1029, 2025. https://doi.org/10.3390/rs17061029
- Rio Tinto. Western Australia iron ore operations. Rio Tinto (operator’s own page). https://www.riotinto.com/en/operations/australia/iron-ore-western-australia
- Marí, R., de Franchis, C., Meinhardt-Llopis, E. and Facciolo, G. Automatic Stockpile Volume Monitoring Using Multi-View Stereo from SkySat Imagery. 2021 IEEE International Geoscience and Remote Sensing Symposium (IGARSS), 2021. https://doi.org/10.1109/IGARSS47720.2021.9554482