How Earth observation works
A guide for anyone new to satellite data, and for readers who want the physics behind it. It starts with light and builds up to the kinds of data a supplier can offer and the work they are used for.
How to read it
Every page has two parts. The basics comes first. It says in plain language what the page is about, gives an everyday example and says why it matters, with one simple picture and no equations. In depth follows, with the physics, the equations, full figures and the sources, numbered in square brackets and listed at the foot of each page.
You can read only the basics of every page and still come away with a correct picture of how Earth observation works. The pages run in a teaching order, simple to complex, and each one ends with a link to the next. The foundations explain what a satellite measures and how it flies. The kinds of data build on them one sensor at a time, the products page says what the levels in a product description mean when you order, and the analysis pages explain what is then done with the data, by established methods and by machine learning. The applications show the work it is used for, sector by sector.
Foundations
Kinds of data
- Optical imaging A calibrated camera in orbit, and the light that reaches it.
- Multispectral imaging A handful of broad bands, and the vegetation and water indices built from them.
- Hyperspectral imaging Hundreds of narrow bands, so every pixel carries a spectrum.
- Thermal imaging Heat the ground gives off, by day and by night.
- Radar imaging A satellite that brings its own microwaves and sees through cloud.
- Radar interferometry Two radar images that measure ground motion to millimetres.
- Night lights Light from cities, flares and fishing fleets seen from orbit at night.
- Elevation Surface and terrain models, and three ways to measure height.
Products
Analysis
Applications
-
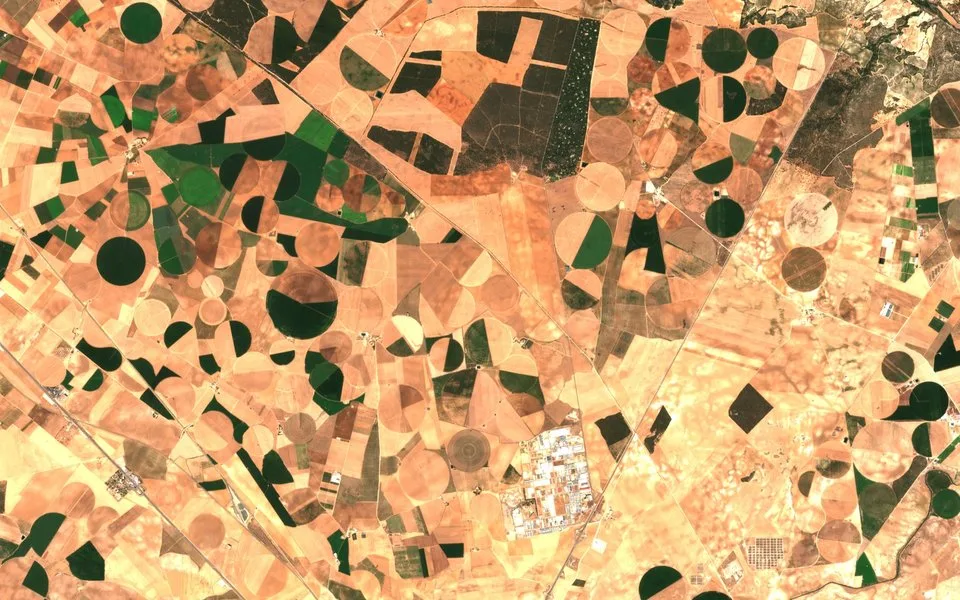 Agriculture Crop types, crop condition, yield forecasts, water use and crop insurance.
 -
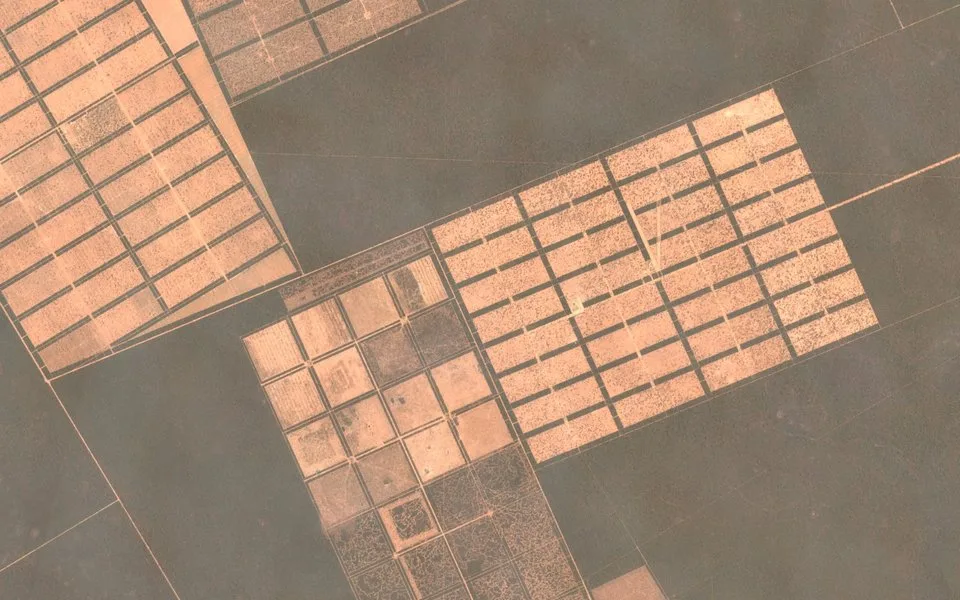 Forestry Forest loss and alerts, biomass and carbon, inventory and fire.
 -
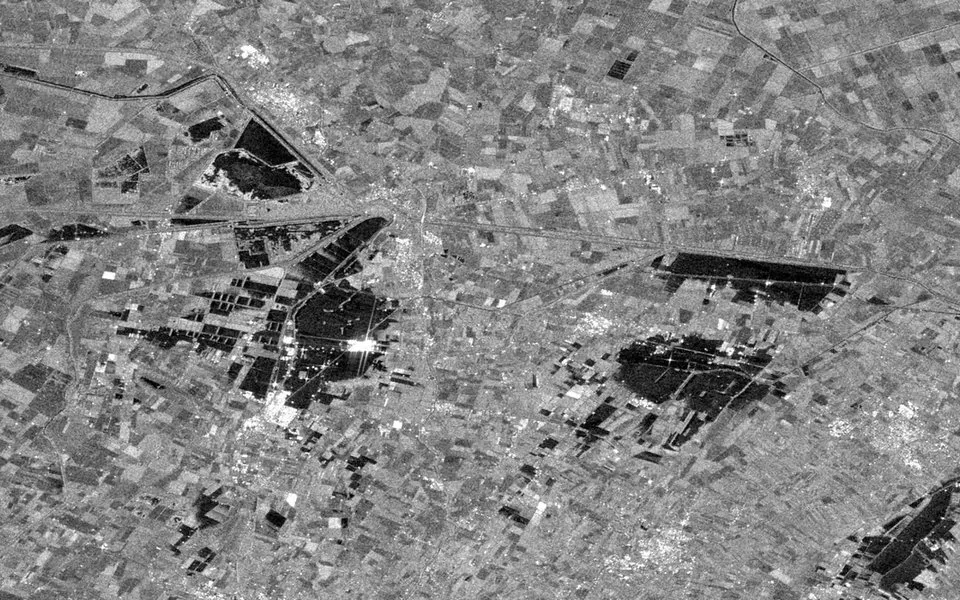 Floods and disasters Flood extent and depth, floods in towns and earthquake damage.
 -
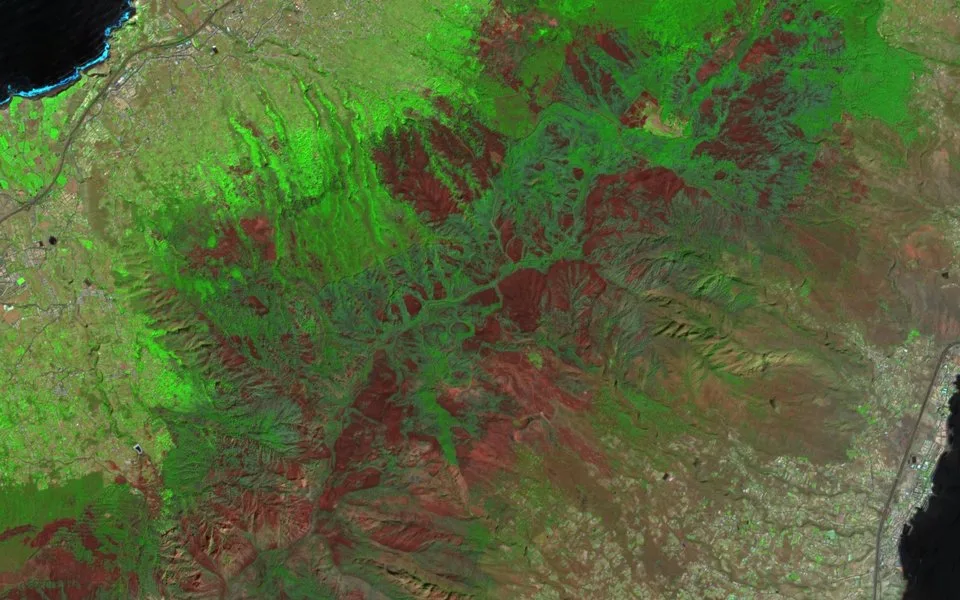 Insurance Exposure, loss assessment, wildfire, parametric cover and subsidence.
 -
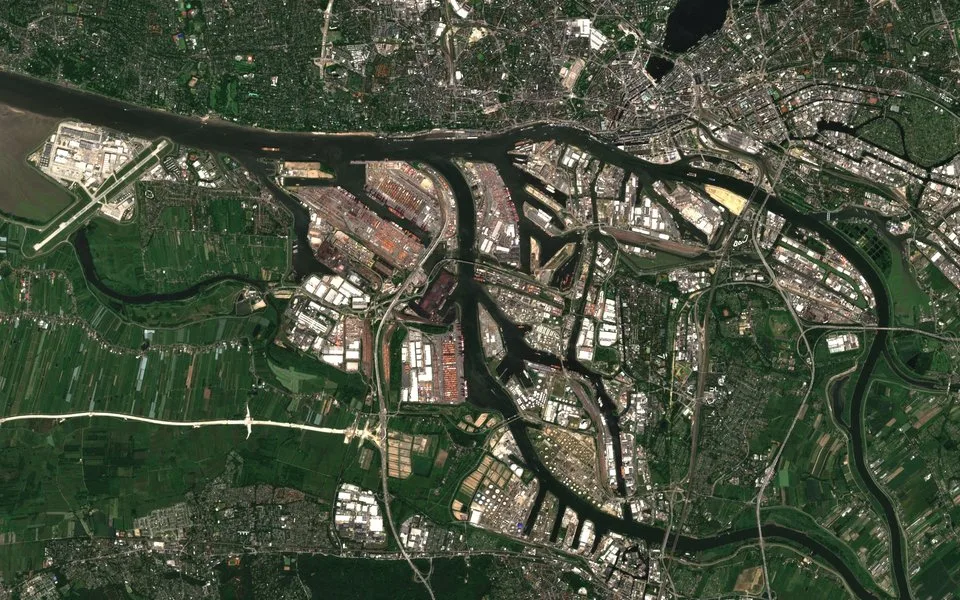 Financial services Economic activity, poverty mapping, deforestation rules and asset monitoring.
 -
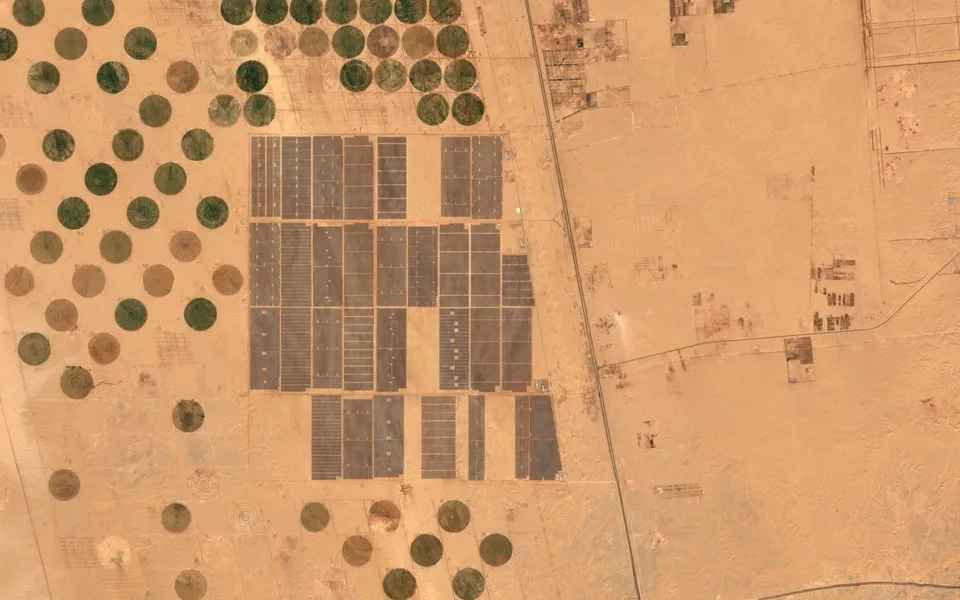 Energy Solar parks, offshore wind, methane leaks, power lines and pipelines.
 -
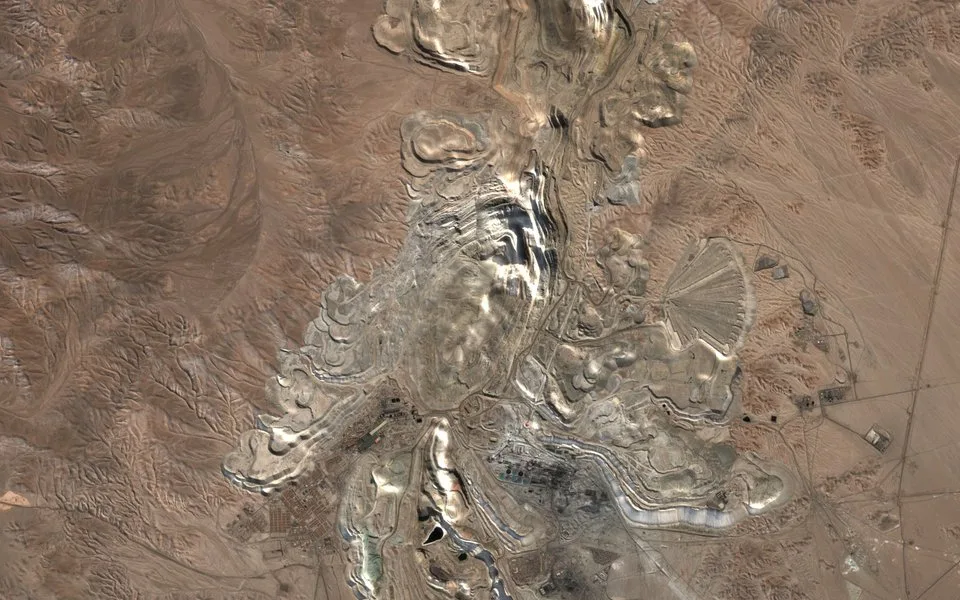 Mining and commodities Mine footprints, tailings dam stability, mineral mapping and commodity supply.
 -
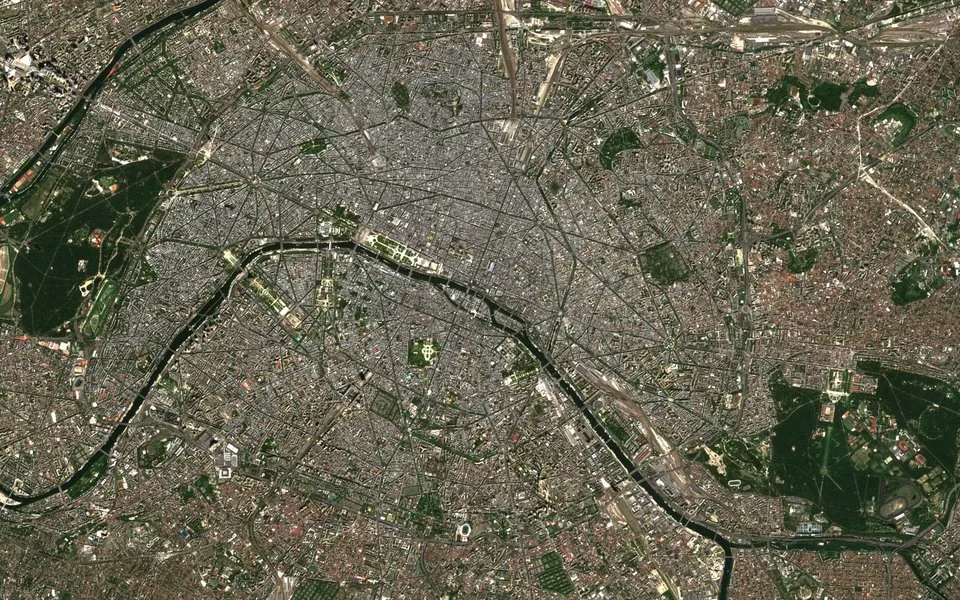 Urban areas and infrastructure Settlement mapping, ground and building movement, bridges and urban heat.
 -
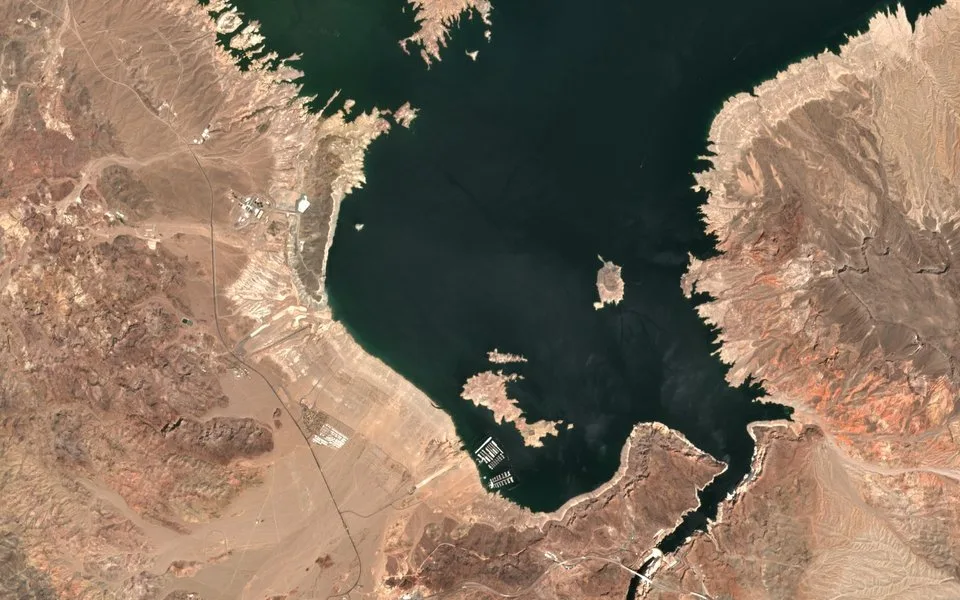 Climate and environment Climate variables, surface water, ice, coastlines and the atmosphere.
 -
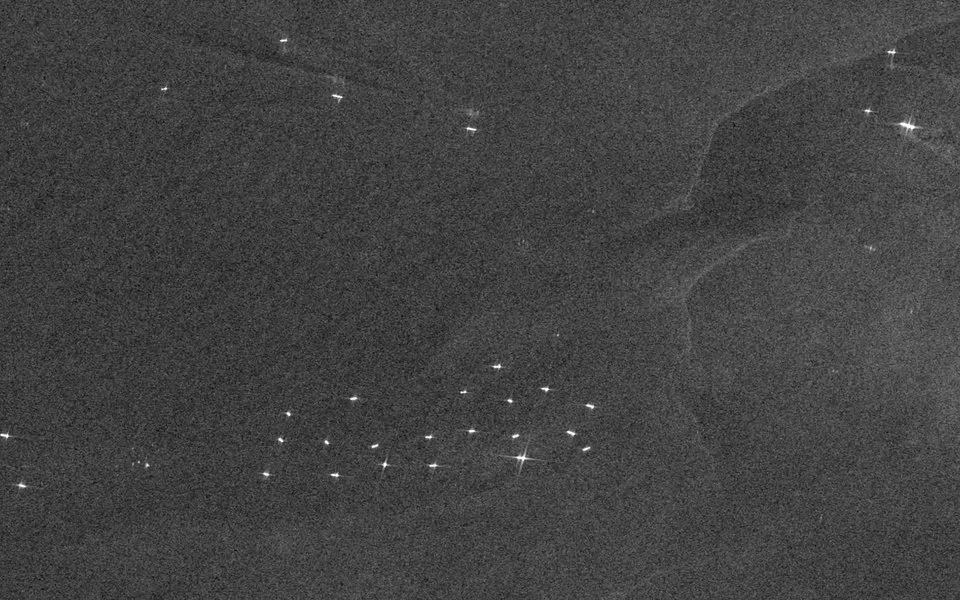 Maritime Ship detection, vessels that do not broadcast, oil spills and night fishing.
 -
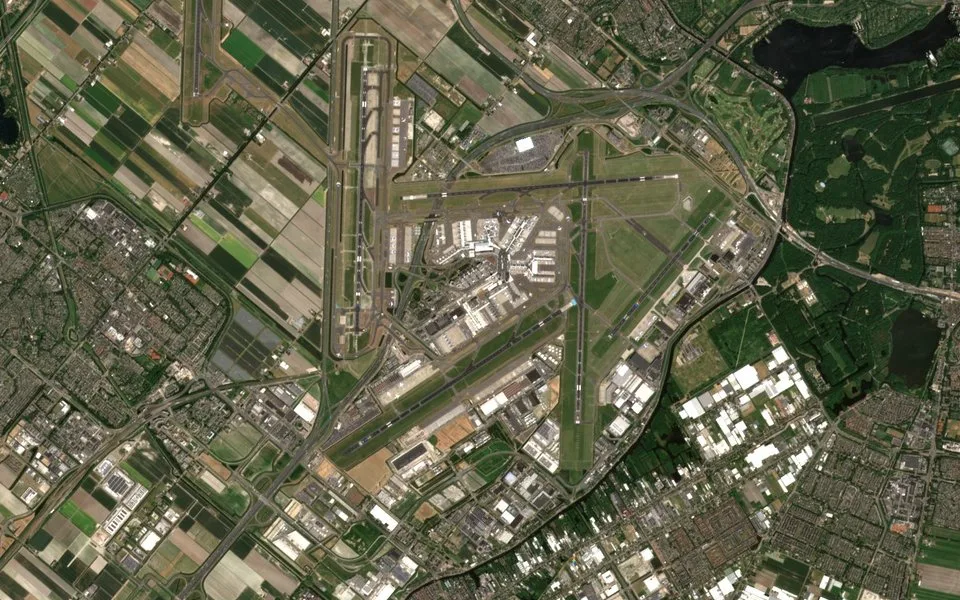 Defence and security Image detail, change detection, radar coherence, maritime awareness and terrain.
Which data suit which sector, with the strengths and limits of each kind.