Earth observation guideApplications
Agriculture
A satellite sees every field every few days, so a growing season can be followed as it happens rather than judged at harvest.
The basics
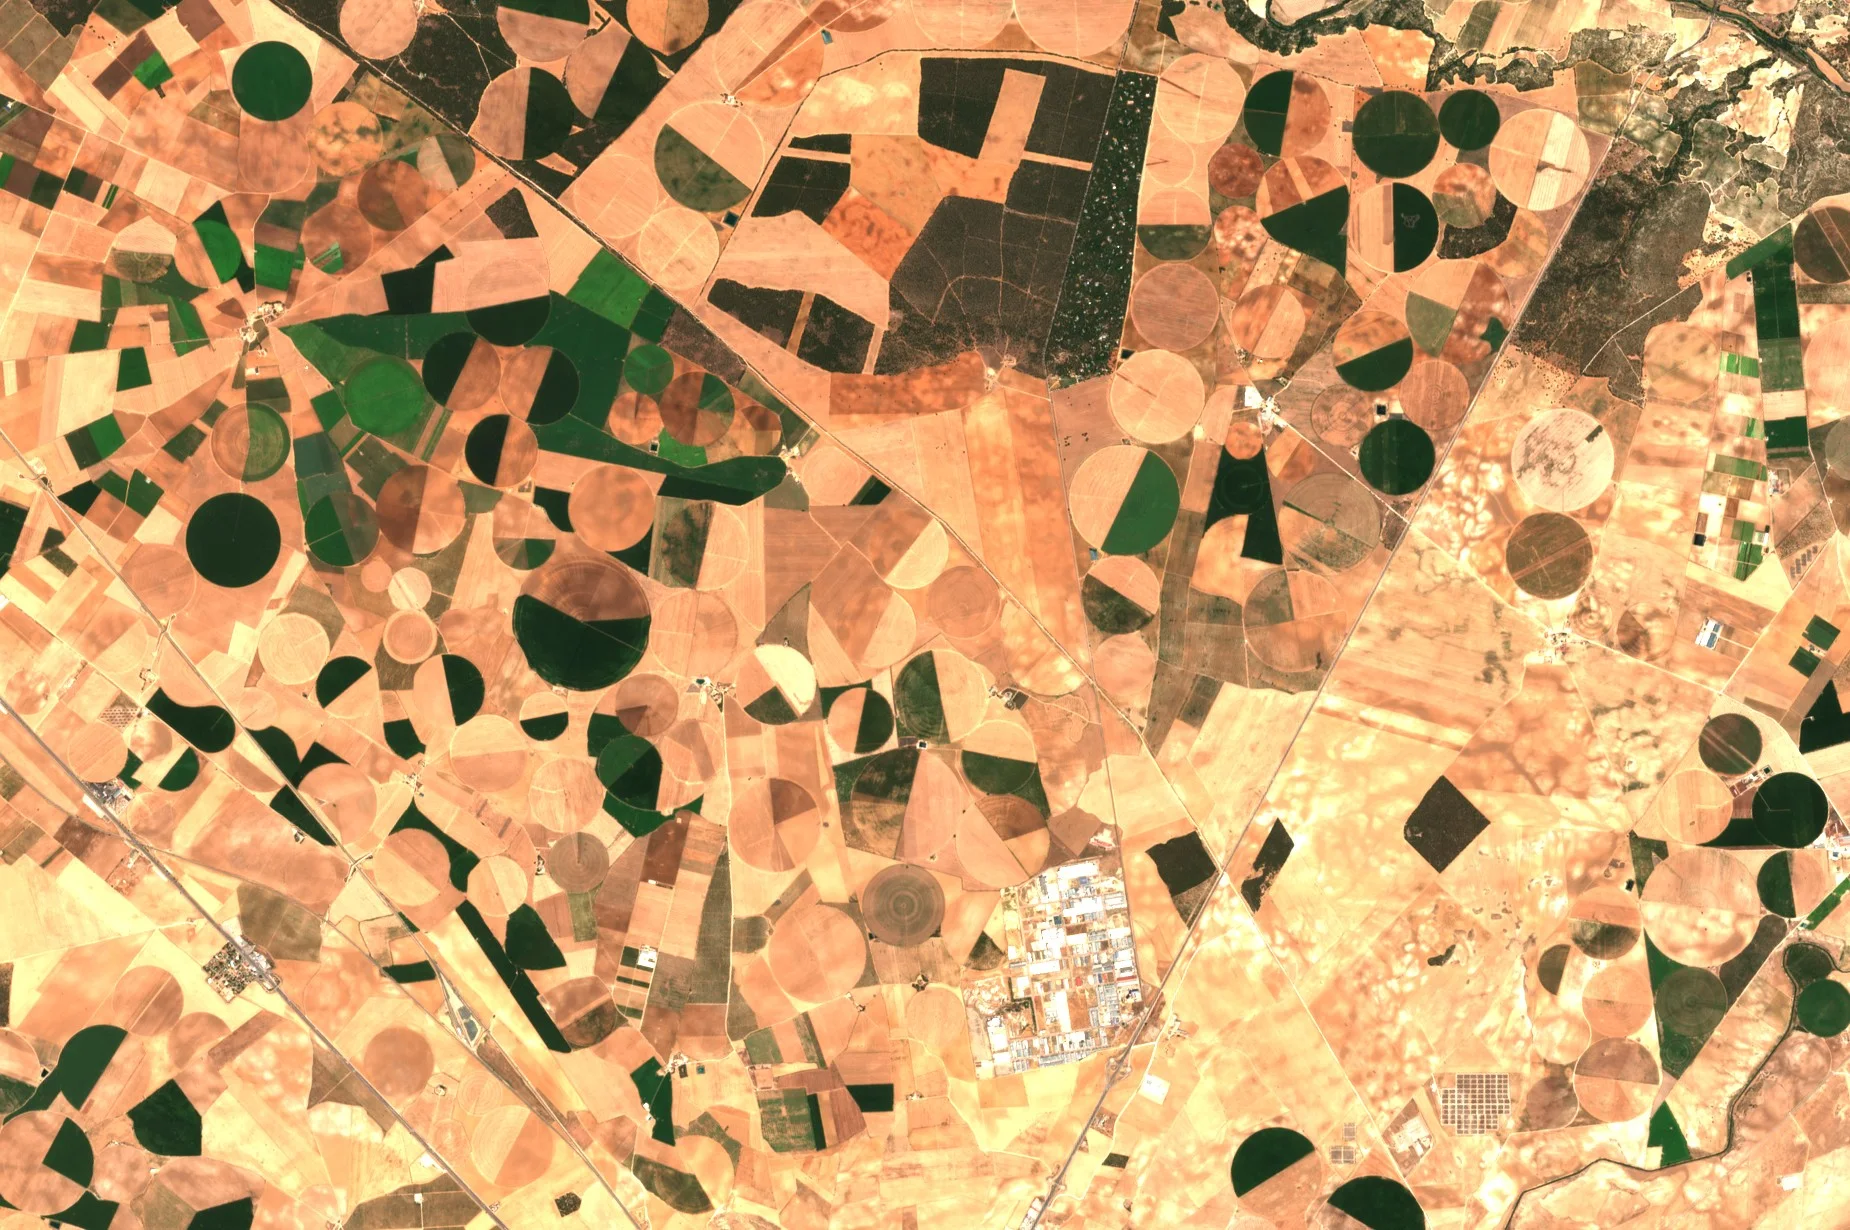
A farmer walking a field sees the part of it within reach. A satellite sees all of it, and every field around it, every few days. Plants that are growing well look different from plants that are short of water or food, and the difference shows up in the satellite's pictures before it is obvious from the gate. That lets a farmer send water, fertiliser or a sprayer to the patch that needs it. Added up over a whole region, the same pictures show which crops were planted where and how the harvest is shaping up, which matters to grain traders, lenders, insurers and governments planning food supplies.
Why it matters
Food prices, farm incomes and food security all depend on harvests that are hard to measure until they are in. Satellite data give an early, independent and consistent view of every field, which no number of field visits could match.
In depth
Crop monitoring rests on the vegetation indices of the multispectral page, followed through the season, with radar filling the gaps where cloud blocks optical imagery. A meta-review of the field covers the techniques, the crop variables and plant traits that remote sensing can estimate, and applications such as land use monitoring and yield forecasting [1]. Open data have made field-scale work routine. Sentinel-2 records 13 bands, four of them at 10 m, and its two satellites were designed to revisit a place every five days at the equator and more often at higher latitudes [2]. Sentinel-1 adds radar images that do not depend on sunlight or clear skies [3]. The sections below take five common uses in turn.
Crop type mapping
Every crop has its own calendar. Winter wheat greens up in spring and is cut in early summer, maize and soya grow later and stay green into autumn, and the order in which fields green, peak and brown separates them better than any single image can. A classifier trained on fields of known type then labels every other field. An automatic system that used all available high resolution optical images of a country produced land cover maps with 17 classes and a kappa coefficient of 0.86, using existing databases rather than new field surveys for training and validation [4]. Radar adds a second view of the same growth, because the strength of the radar echo and the ratio of its two polarisations change as the canopy develops, and it keeps recording when cloud hides the optical bands [5].
- What is measured
- How reflectance in the visible, red edge and infrared bands, and radar backscatter, change over the season in each field.
- Data
- Multispectral images at 10 to 20 m, and radar at around 10 to 20 m where cloud is frequent.
- How often
- Every usable pass through the season, giving one map per season or year.
- Limits
- Needs reliable labelled fields to train on. Fields smaller than a few pixels, and mixed or intercropped plots, are hard to label.
- Who uses it
- Agricultural statistics agencies, ministries paying area-based subsidies, commodity analysts and food companies tracking their sourcing regions.
Crop condition
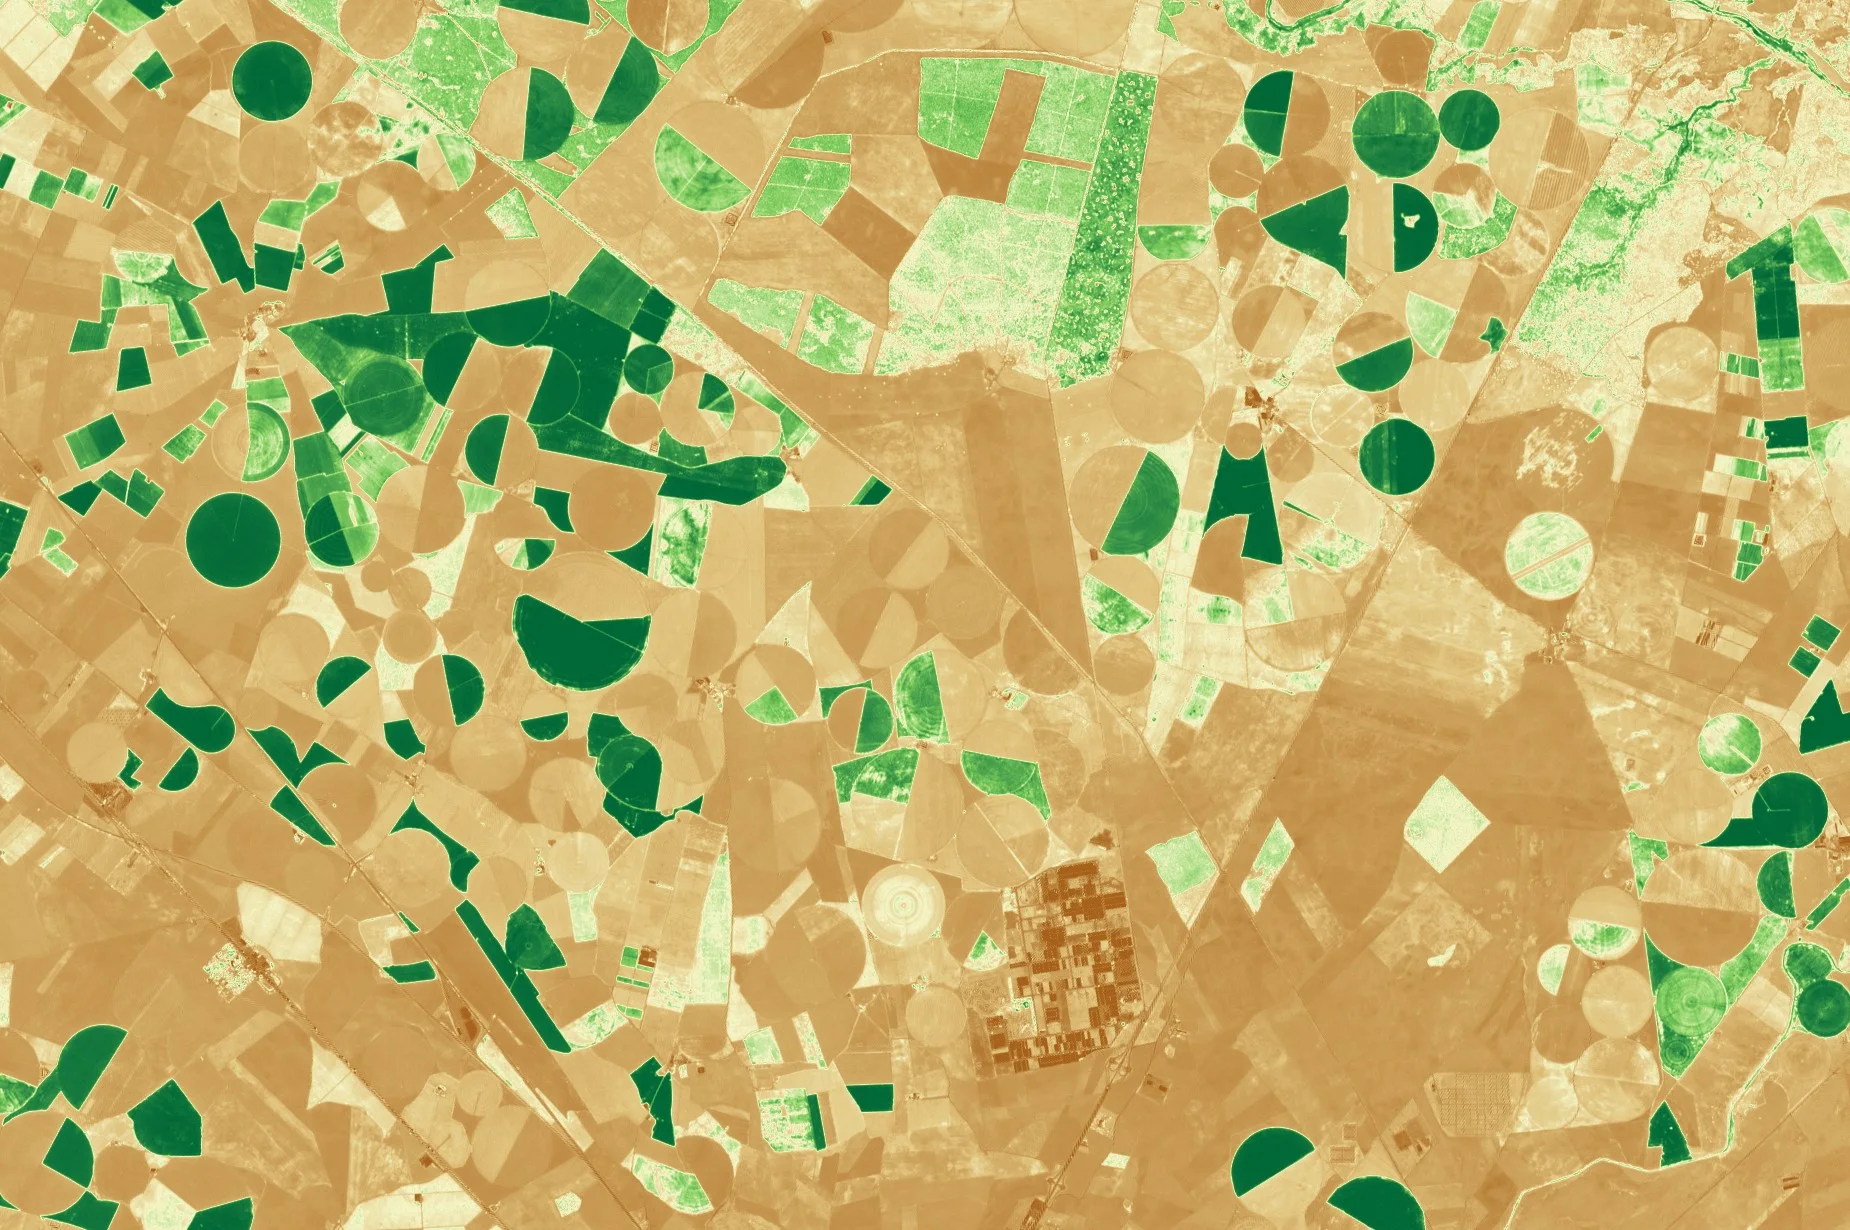
Healthy leaves absorb red light and reflect strongly in the near infrared, so the normalised difference of the two bands rises with green, actively growing vegetation [6]. A map of the index across a field shows where the crop is ahead or behind, and a series of maps shows whether a weak patch is recovering. Sentinel-2's three narrow bands on the red edge, at 20 m, add sensitivity to chlorophyll, and a study using field campaigns in Spain and Italy assessed how well they estimate canopy chlorophyll content and leaf area index [7].
- What is measured
- Vegetation indices such as NDVI, and red edge estimates of chlorophyll and leaf area.
- Data
- Multispectral at 10 to 20 m for whole fields, or finer optical imagery for small plots and trials.
- How often
- Every clear pass, every few days in the growing season.
- Limits
- An index shows that a patch differs, not why. Drought, disease, pests and poor soil can look alike, so a field visit is still needed to diagnose. Cloud leaves gaps.
- Who uses it
- Farmers and agronomists, and the precision farming services that turn the maps into variable rate plans for machinery.
Yield forecasting
A crop that has been green for longer, over more of its area, usually yields more. Regression models built on a satellite vegetation index have forecast winter wheat yields for whole regions, as in a model developed for Kansas and Ukraine [8]. Field-level yield maps are harder because yields measured on the ground are scarce. One answer is to use crop model simulations, rather than yield records, to calibrate the link between a vegetation index and yield, so that the method can be applied wherever images exist [9]. Both lines of work belong to the wider set of yield applications reviewed in [1].
- What is measured
- Vegetation indices through the season, summarised over a field or region and related to final yield.
- Data
- Daily coarse multispectral data for regional forecasts, and 10 to 30 m data for fields.
- How often
- Updated through the season, with forecasts firming up as the crop nears maturity.
- Limits
- Weather after the last image, such as hail or a wet harvest, is not seen in advance. Each model needs calibrating for a crop and region.
- Who uses it
- Grain traders, food processors, lenders to farms and governments monitoring food security.
Irrigation and water stress
Leaves short of water reflect more in the shortwave infrared, and an index built from the near and shortwave infrared measures the water held in vegetation [10]. Water use itself can be estimated from the energy balance of the surface. The METRIC model calculates evapotranspiration, the water that evaporates from soil and leaves, as the remainder of the energy balance, using short-wave and thermal images, an elevation model and weather data, and is calibrated against ground-based reference evapotranspiration so that results can be given field by field [11].
- What is measured
- Leaf water content, surface temperature and the evapotranspiration derived from them.
- Data
- Thermal imagery for the energy balance, multispectral shortwave infrared bands for leaf water, and an elevation model in hilly ground.
- How often
- Each clear overpass of a thermal sensor, which for field-scale thermal data is usually less frequent than for optical bands.
- Limits
- Thermal pixels are coarser than optical ones, so small fields blur together. The method needs weather data from nearby and trained operators.
- Who uses it
- Irrigation districts, water regulators checking abstraction, and engineers planning irrigation schedules.
Parametric crop insurance
Sending an assessor to every insured farm after a loss is costly. Index insurance instead pays out when a measured index, such as rainfall or a satellite estimate of yield, falls below a set level. A review of the field describes how loss estimation for index insurance has moved from costly field sampling towards cheaper methods using weather and satellite data, and stresses that the value of a contract depends on how well the index captures losses when farmers suffer most [12]. The gap between the index and a farmer's actual loss is known as basis risk. The insurance page covers the insurer's side.
- What is measured
- A seasonal index, such as accumulated vegetation index or a modelled yield, over an insured area.
- Data
- Long, consistent multispectral records, so that a bad year can be judged against many past years.
- How often
- Through the season, with a settlement once it ends.
- Limits
- Basis risk, and the need for a long and stable record to price the cover.
- Who uses it
- Insurers and reinsurers, governments running agricultural support schemes and development agencies.
Natural colour
Vegetation index (NDVI)
References
- Weiss, M., Jacob, F. and Duveiller, G. (2020) Remote sensing for agricultural applications: A meta-review. Remote Sensing of Environment, 236, 111402. https://doi.org/10.1016/j.rse.2019.111402
- Drusch, M., Del Bello, U., Carlier, S. et al. (2012) Sentinel-2: ESA's Optical High-Resolution Mission for GMES Operational Services. Remote Sensing of Environment, 120, 25-36. https://doi.org/10.1016/j.rse.2011.11.026
- Torres, R., Snoeij, P., Geudtner, D. et al. (2012) GMES Sentinel-1 mission. Remote Sensing of Environment, 120, 9-24. https://doi.org/10.1016/j.rse.2011.05.028
- Inglada, J., Vincent, A., Arias, M. et al. (2017) Operational High Resolution Land Cover Map Production at the Country Scale Using Satellite Image Time Series. Remote Sensing, 9(1), 95. https://doi.org/10.3390/rs9010095
- Veloso, A., Mermoz, S., Bouvet, A. et al. (2017) Understanding the temporal behavior of crops using Sentinel-1 and Sentinel-2-like data for agricultural applications. Remote Sensing of Environment, 199, 415-426. https://doi.org/10.1016/j.rse.2017.07.015
- Tucker, C. J. (1979) Red and photographic infrared linear combinations for monitoring vegetation. Remote Sensing of Environment, 8(2), 127-150. https://doi.org/10.1016/0034-4257(79)90013-0
- Frampton, W. J., Dash, J., Watmough, G. and Milton, E. J. (2013) Evaluating the capabilities of Sentinel-2 for quantitative estimation of biophysical variables in vegetation. ISPRS Journal of Photogrammetry and Remote Sensing, 82, 83-92. https://doi.org/10.1016/j.isprsjprs.2013.04.007
- Becker-Reshef, I., Vermote, E., Lindeman, M. and Justice, C. (2010) A generalized regression-based model for forecasting winter wheat yields in Kansas and Ukraine using MODIS data. Remote Sensing of Environment, 114(6), 1312-1323. https://doi.org/10.1016/j.rse.2010.01.010
- Lobell, D. B., Thau, D., Seifert, C., Engle, E. and Little, B. (2015) A scalable satellite-based crop yield mapper. Remote Sensing of Environment, 164, 324-333. https://doi.org/10.1016/j.rse.2015.04.021
- Gao, B.-C. (1996) NDWI - A normalized difference water index for remote sensing of vegetation liquid water from space. Remote Sensing of Environment, 58(3), 257-266. https://doi.org/10.1016/S0034-4257(96)00067-3
- Allen, R. G., Tasumi, M. and Trezza, R. (2007) Satellite-Based Energy Balance for Mapping Evapotranspiration with Internalized Calibration (METRIC) - Model. Journal of Irrigation and Drainage Engineering, 133(4), 380-394. https://doi.org/10.1061/(ASCE)0733-9437(2007)133:4(380)
- Benami, E., Jin, Z., Carter, M. R. et al. (2021) Uniting remote sensing, crop modelling and economics for agricultural risk management. Nature Reviews Earth & Environment, 2(2), 140-159. https://doi.org/10.1038/s43017-020-00122-y