Earth observation guideApplications
Energy
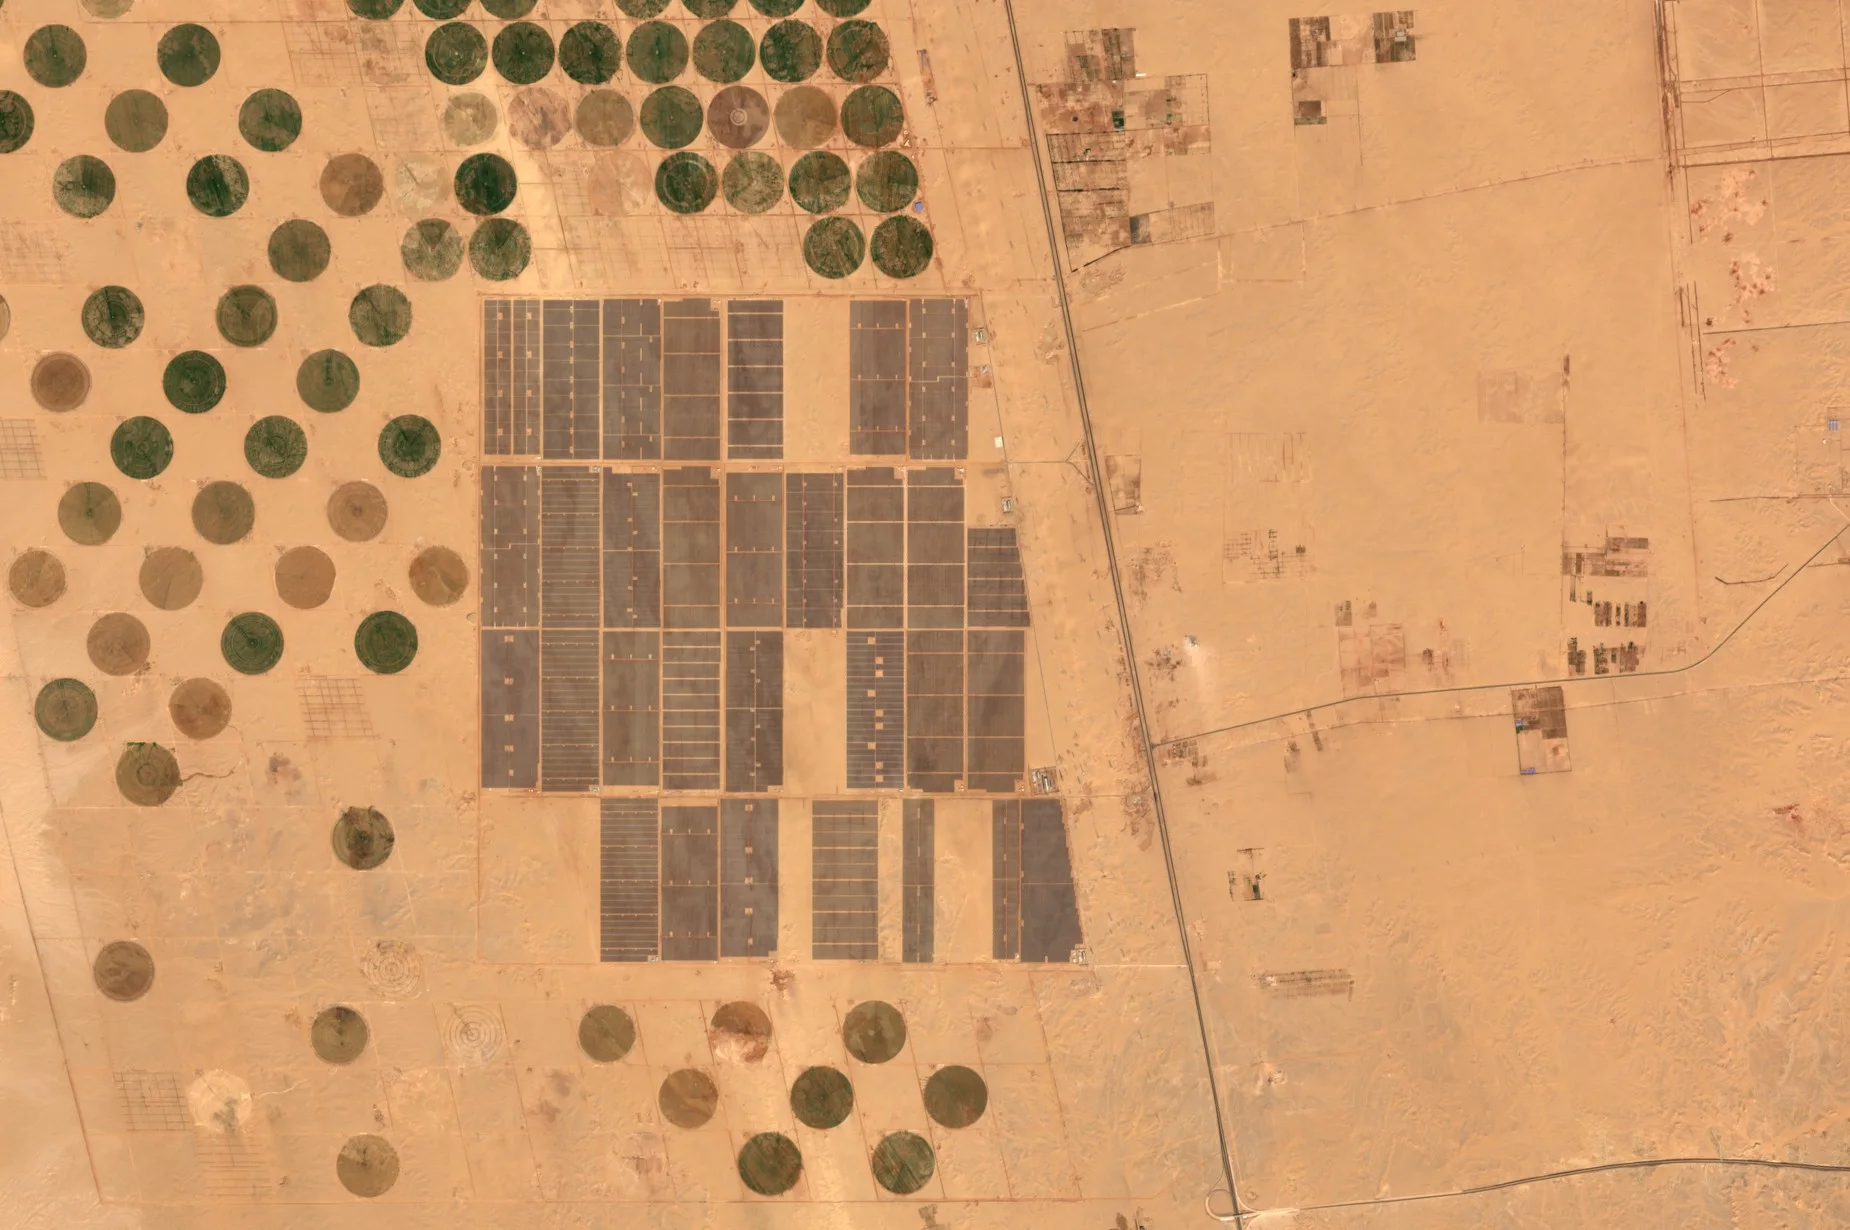
From solar parks in the desert to wind turbines at sea and leaks from gas fields, the energy system is large, spread out and visible from orbit.
The basics
Power stations, solar parks, wind farms, pipelines and power lines cover huge areas, often far from roads and people. Inspecting them all on foot or by helicopter is slow and costly. Satellites show where new solar parks and wind turbines are being built, whether trees are growing too close to power lines, and whether the ground under a pipeline is moving. Some satellites can even see large plumes of methane, a powerful greenhouse gas, escaping from oil and gas sites, which helps operators find and fix leaks.
Why it matters
Energy networks must stay reliable and safe while they change quickly towards renewables. Knowing where assets are, what threatens them and what they emit helps operators, regulators and investors plan.
In depth
Energy companies, their investors and regulators use Earth observation to build inventories of generating assets, to watch for hazards along networks and to measure emissions. Each task draws on a different data type, from 10 m multispectral images for mapping, through radar at sea, to shortwave infrared spectra for gases.
Solar installations
Photovoltaic generating capacity has grown by 41 per cent a year since 2009, faster than registers can follow. A global inventory built with machine learning on remote sensing images located 68,661 commercial, industrial and utility-scale facilities, with an estimated capacity of 423 gigawatts at the end of 2018, and found that most were sited on cropland, followed by arid land and grassland [1].
- What is measured
- The outline of each installation and, from its area, an estimate of capacity, together with the land cover it replaced.
- Data
- Multispectral imagery at 10 m for large parks, and finer optical images for rooftop and small commercial systems.
- How often
- Annual or quarterly updates as new sites are built.
- Limits
- Capacity is inferred from area, not measured, and small rooftop systems are below the resolution of open data.
- Who uses it
- Grid operators forecasting generation, energy analysts, investors and land use planners.
Offshore wind
A wind turbine standing in the sea is a bright point on dark water in a radar image. Two neural networks searching the whole Sentinel-1 archive produced DeepOWT, a global dataset of 9,941 offshore wind energy installations with their stages of deployment, built only from freely accessible data [2]. A separate global study of the coastal ocean from 2017 to 2021 found offshore wind growing rapidly, with the number of turbines surpassing the number of oil structures in 2021 [3].
- What is measured
- The location of each turbine and platform, and when its foundation, tower and blades appeared.
- Data
- Radar at 10 to 20 m, which sees through the cloud common over northern seas.
- How often
- Every few days per site, summarised quarterly or annually.
- Limits
- Ships and other platforms can be confused with turbines, which is why time series and context are used to confirm them.
- Who uses it
- Developers, marine planners, fisheries managers and investors following the build-out.
Methane leaks
Methane absorbs sunlight in the shortwave infrared, so a large plume darkens the ground beneath it in those bands. Sentinel-2's bands 11 and 12, at 20 m with a revisit of two to five days, can detect and quantify point sources down to about 3 tonnes an hour over favourable, uniform ground. Watching a well pad in Algeria every 2.5 days, the method detected its plume in 93 per cent of cloud-free scenes, at an average of 9.3 tonnes an hour, until a flare was lit in August 2020 [4]. At a coarser scale, the TROPOMI instrument on Sentinel-5 Precursor [5] found hundreds of very large releases from oil and gas in 2019 and 2020. These ultra-emitters added up to 8 to 12 per cent of global methane emissions from oil and gas production, about 8 million tonnes a year [6].
- What is measured
- Extra absorption by methane in shortwave infrared bands, converted to a column enhancement and then to an emission rate with wind data.
- Data
- Multispectral shortwave infrared for large point sources, hyperspectral imagers for smaller ones, and atmospheric spectrometers at kilometre scale for regions.
- How often
- Daily for the atmospheric instruments, every few days for Sentinel-2.
- Limits
- Only large sources show in multispectral bands, bright or varied ground causes false signals, and cloud stops every optical method.
- Who uses it
- Oil and gas operators, regulators, investors and climate researchers.
Power line corridors
Trees that grow into power lines cause outages and fires. A review of remote sensing for power line corridor surveys covers radar, optical satellite and aerial images, thermal images, airborne laser scanning, mobile mapping and drones. It found that most studies have concentrated on the network components, with accuracies above 90 per cent reported for extracting conductors from laser scanning or aerial images, while mapping vegetation near the lines has been studied less, mainly with optical aerial and satellite images [7].
- What is measured
- Vegetation height and distance from conductors, and the condition of towers and lines.
- Data
- Stereo optical imagery and elevation models for tree height, and multispectral data for vegetation growth.
- How often
- Once or twice a year, timed with the growing season.
- Limits
- Satellite images cannot resolve conductors themselves, so detailed clearance checks still rely on laser scanning from the air.
- Who uses it
- Transmission and distribution network operators.
Pipelines and ground movement
Pipelines and other buried assets can be strained by landslides, subsidence or heave. Persistent scatterer interferometry measures displacement of the ground over time from stacks of radar images, and a review of the technique discusses its data needs, the deformation rates it can follow and its validation [8]. The urban areas and infrastructure page covers the method in more detail.
- What is measured
- Millimetre-scale ground motion along a route over months and years.
- Data
- Stacks of radar images processed by interferometry.
- How often
- Updated with each new image, every few days to weeks.
- Limits
- Needs stable reflectors, which can be scarce along rural routes, and sees motion only along the radar's line of sight.
- Who uses it
- Pipeline operators and geotechnical engineers.
References
- Kruitwagen, L., Story, K. T., Friedrich, J. et al. (2021) A global inventory of photovoltaic solar energy generating units. Nature, 598(7882), 604-610. https://doi.org/10.1038/s41586-021-03957-7
- Hoeser, T., Feuerstein, S. and Kuenzer, C. (2022) DeepOWT: a global offshore wind turbine data set derived with deep learning from Sentinel-1 data. Earth System Science Data, 14(9), 4251-4270. https://doi.org/10.5194/essd-14-4251-2022
- Paolo, F. S., Kroodsma, D., Raynor, J. et al. (2024) Satellite mapping reveals extensive industrial activity at sea. Nature, 625(7993), 85-91. https://doi.org/10.1038/s41586-023-06825-8
- Varon, D. J., Jervis, D., McKeever, J. et al. (2021) High-frequency monitoring of anomalous methane point sources with multispectral Sentinel-2 satellite observations. Atmospheric Measurement Techniques, 14(4), 2771-2785. https://doi.org/10.5194/amt-14-2771-2021
- Veefkind, J. P., Aben, I., McMullan, K. et al. (2012) TROPOMI on the ESA Sentinel-5 Precursor: A GMES mission for global observations of the atmospheric composition for climate, air quality and ozone layer applications. Remote Sensing of Environment, 120, 70-83. https://doi.org/10.1016/j.rse.2011.09.027
- Lauvaux, T., Giron, C., Mazzolini, M. et al. (2022) Global assessment of oil and gas methane ultra-emitters. Science, 375(6580), 557-561. https://doi.org/10.1126/science.abj4351
- Matikainen, L., Lehtomäki, M., Ahokas, E. et al. (2016) Remote sensing methods for power line corridor surveys. ISPRS Journal of Photogrammetry and Remote Sensing, 119, 10-31. https://doi.org/10.1016/j.isprsjprs.2016.04.011
- Crosetto, M., Monserrat, O., Cuevas-González, M., Devanthéry, N. and Crippa, B. (2016) Persistent Scatterer Interferometry: A review. ISPRS Journal of Photogrammetry and Remote Sensing, 115, 78-89. https://doi.org/10.1016/j.isprsjprs.2015.10.011